Victory Fund Releases Candidate Data on 2018 Rainbow Wave;
244 Out LGBTQ Candidates Won Elected Office in 2018
Data provides look at sexual orientation and gender identity of candidates
Washington, DC – LGBTQ Victory Fund released a demographic and informational breakdown of the 432 openly LGBTQ candidates on the ballot this past Election Day – looking at sexual orientation, gender identity, race/ethnicity, office level, party affiliation, and the equality levels of the states they ran in. Of those, 244 won, including 162 victorious Victory Fund endorsed candidates. Previously, Victory Fund released data on its endorsed candidates, but the data released today looks at all known openly LGBTQ candidates who were on the ballot on November 6.
The breakdown of data is below. A visual representation of the data is available at victoryfund.org/rainbowwave.
Among the key takeaways from the new data:
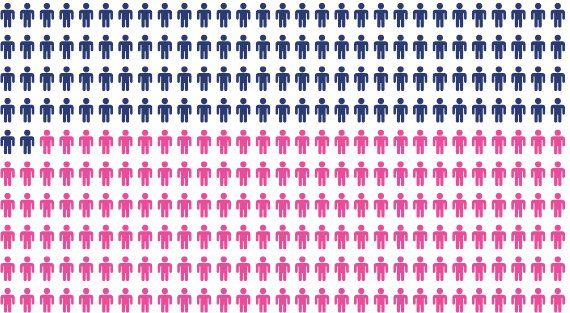
- 56.5 percent of known openly LGBTQ candidates won their races on Election Day, and 72.0 percent of Victory Fund endorsed candidates were successful;
- 136 of the 244 victorious candidates are non-incumbents and 79.3 percent of incumbent candidates won their races;
- LGBTQ men ran in higher numbers than LGBTQ women, yet women candidates won at a higher rate (63.4 percent to 56.7 percent);
- 25.0 percent of LGBTQ candidates who ran were people of color and 56.5 percent won their races; and
- 86.1 percent of LGBTQ candidates ran as Democrats and 61.0 percent won, whereas 5.3 percent of LGBTQ candidates ran as Republicans and just 17.4 percent won.
“Never in our nation’s history have so many openly LGBTQ people decided to run for office and be the change they demand to see in the world – and we are determined to ensure this energy does not fade,” said Mayor Annise Parker, President & CEO of LGBTQ Victory Fund. “We were able to ensure many of these leaders crossed the finish line on Election Day, and importantly, LGBTQ incumbents were overwhelmingly reelected by voters in states both red and blue.”
“While the Rainbow Wave of LGBTQ candidates who ran this year was the most diverse ever, there is still a long way to go before equitable representation for our entire community is achieved. It is vital we recruit and train more LGBTQ people of color, women and trans candidates because America needs their voices in the halls of power. LGBTQ political power is growing and we are ready to flex our muscles in local government, state Houses and the U.S. Congress, but as believers in the power of representation, we know LGBTQ candidates and elected officials must reflect our beautifully diverse community.”
Below is a breakdown of data for the 432 openly LGBTQ candidates who were on the ballot on November 6, 2018.*
| 2018 General Election Candidates |
Total on Nov. Ballots |
% of Total |
Wins |
Losses |
Not Decided |
% Won |
| Victory Fund Endorsed LGBTQ Candidates |
225 |
52.1% |
162 |
60 |
3 |
72.0% |
| Non-Endorsed LGBTQ Candidates |
207 |
47.7% |
82 |
123 |
2 |
39.8% |
| All LGBTQ Candidates |
432 |
— |
244 |
183 |
5 |
56.5% |
| Incumbency |
Total on Nov. Ballots |
% of Total |
Wins |
Losses |
Not Decided |
% Won |
| Incumbents |
135 |
31.3% |
107 |
27 |
1 |
79.3% |
| Non-Incumbent |
297 |
68.8% |
136 |
157 |
4 |
45.8% |
| All LGBTQ Candidates |
432 |
— |
244 |
183 |
5 |
56.5% |
| Office Level |
Total Who Ran |
% of Total |
Wins |
Losses |
Not Decided |
% Won |
| Federal |
28 |
6.5% |
10 |
19 |
35.7% |
|
| Governor |
4 |
0.9% |
2 |
2 |
50.0% |
|
| Statewide |
11 |
2.5% |
6 |
5 |
54.5% |
|
| State Legislature |
197 |
45.6% |
110 |
84 |
3 |
55.8% |
| Judicial |
34 |
7.9% |
26 |
8 |
76.5% |
|
| Mayor |
16 |
3.7% |
10 |
6 |
62.5% |
|
| Local (not incl. mayor) |
142 |
32.9% |
80 |
60 |
2 |
56.3% |
| All LGBTQ Candidates |
432 |
— |
244 |
183 |
5 |
56.5% |
| Gender Identity |
Total Who Ran |
% of Total |
Wins |
Losses |
Not Decided |
% Won |
| Men |
215 |
49.8% |
122 |
91 |
2 |
56.7% |
| Women |
172 |
39.8% |
109 |
60 |
3 |
63.4% |
| Trans Men |
8 |
1.9% |
3 |
5 |
37.5% |
|
| Trans Women |
19 |
4.4% |
6 |
13 |
31.6% |
|
| Gender Non-Conforming |
2 |
0.5% |
1 |
1 |
50.0% |
|
| Intersex |
1 |
0.2% |
1 |
0 |
100.0% |
|
| Genderqueer/Non-binary |
3 |
0.7% |
0 |
3 |
0.0% |
|
| Other |
3 |
0.7% |
1 |
2 |
33.3% |
|
| Unknown |
9 |
2.1% |
1 |
8 |
11.1% |
|
| All LGBTQ Candidates |
432 |
— |
244 |
183 |
5 |
56.5% |
| Sexual Orientation | Total Who Ran | % of Total |
Wins |
Losses |
Not Decided |
% Won |
| Gay |
207 |
47.9% |
114 |
91 |
2 |
55.1% |
| Lesbian |
139 |
32.2% |
88 |
48 |
2 |
63.3% |
| Bisexual |
28 |
6.5% |
14 |
14 |
50.0% |
|
| Pansexual |
7 |
1.6% |
6 |
1 |
85.7% |
|
| Queer |
18 |
4.2% |
9 |
8 |
1 |
50.0% |
| Other |
3 |
0.7% |
1 |
2 |
33.3% |
|
| Unknown |
30 |
6.9% |
12 |
18 |
40.0% |
|
| All LGBTQ Candidates |
432 |
— |
244 |
183 |
5 |
56.5% |
| Race/Ethnicity |
Total Who Ran |
% of Total |
Wins |
Losses |
Not Decided |
% Won |
| White/Caucasian |
288 |
66.6% |
172 |
115 |
1 |
59.7% |
| Latinx/Hispanic; |
48 |
11.1% |
23 |
22 |
3 |
47.9% |
| African American/Black/ Afro-Caribbean |
25 |
5.8% |
17 |
8 |
68.0% |
|
| Asian/Asian Pacific Islander |
17 |
3.9% |
12 |
5 |
70.6% |
|
| Native American/
Alaska Native |
3 |
0.7% |
2 |
1 |
66.7% |
|
| Arab American/ Middle Eastern |
2 |
0.5% |
1 |
1 |
50.0% |
|
| Multiracial |
13 |
3.0% |
6 |
7 |
46.2% |
|
| Unknown |
36 |
8.3% |
11 |
24 |
1 |
30.6% |
| All LGBTQ Candidates |
432 |
— |
244 |
183 |
5 |
56.5% |
| Party Affiliation | Total Who Ran | % of Total |
Wins |
Losses |
Not Decided |
% Won |
| Democrat |
372 |
86.1% |
227 |
140 |
5 |
61.0% |
| Republican |
23 |
5.3% |
4 |
19 |
17.4% |
|
| Independent |
8 |
1.9% |
3 |
5 |
37.5% |
|
| Libertarian |
8 |
1.9% |
0 |
8 |
0.0% |
|
| Green |
5 |
1.2% |
1 |
4 |
20.0% |
|
| Non-Partisan |
6 |
1.4% |
3 |
3 |
50.0% |
|
| Other |
4 |
0.9% |
2 |
2 |
50.0% |
|
| Unknown |
6 |
1.4% |
4 |
2 |
66.7% |
|
| All LGBTQ Candidates |
432 |
— |
244 |
183 |
5 |
56.5% |
| State Equality Level** |
Total Who Ran |
% of Total |
Wins |
Losses |
Not Decided |
% Won |
| High-Equality State |
211 |
48.8% |
130 |
77 |
4 |
61.6% |
| Medium-Equality State |
25 |
5.8% |
11 |
14 |
44.0% |
|
| Low-Equality State |
172 |
39.8% |
89 |
81 |
1 |
51.7% |
| Negative-Equality State |
21 |
4.9% |
12 |
9 |
57.1% |
|
| Unknown (Guam) |
3 |
0.7% |
2 |
1 |
66.7% |
|
| All LGBTQ Candidates |
432 |
— |
244 |
183 |
5 |
56.5% |
*Wins and losses numbers may not add up to the total who ran in certain categories because some races remain undecided.
** As defined by the Movement Advancement Project.
_________________
LGBTQ Victory Fund
LGBTQ Victory Fund works to change the face and voice of America’s politics and achieve equality for LGBTQ Americans by increasing the number of openly LGBTQ elected officials at all levels of government.


